Blake Patterson · 7 October 2026
Environmental Mapping Project Highlights Downfield's Natural Assets
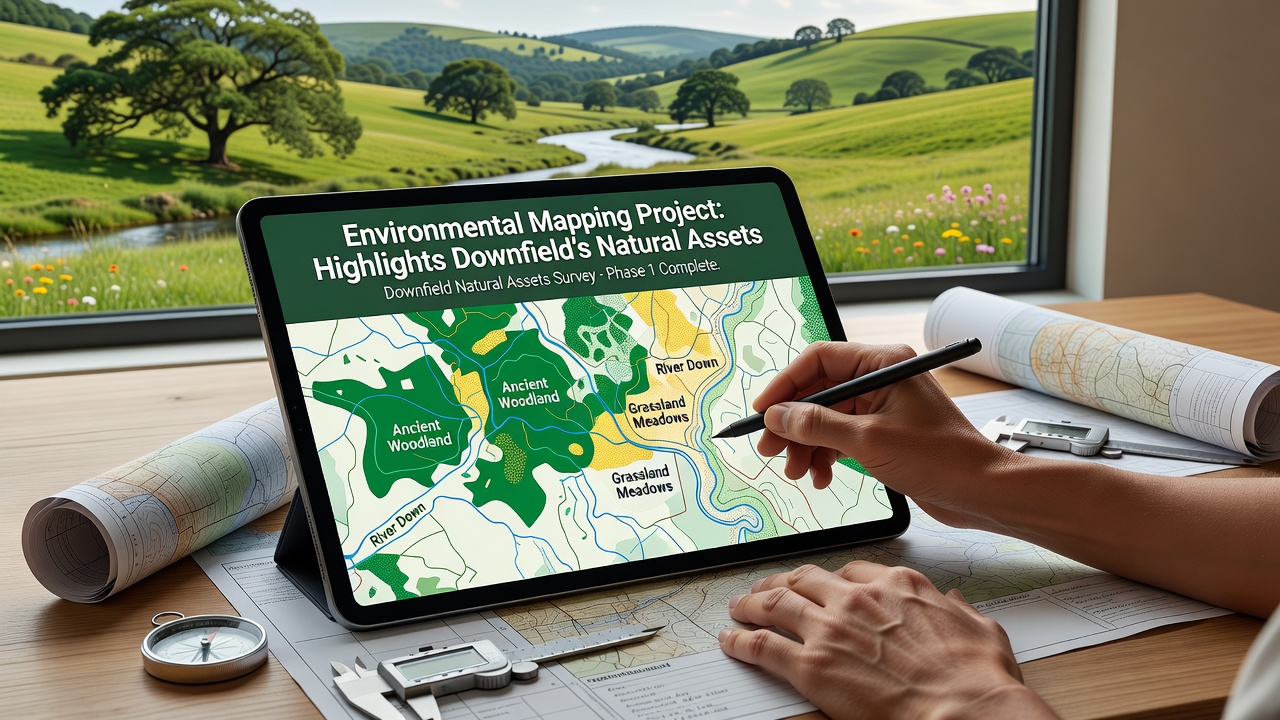
Downfield's environmental mapping project has delivered detailed data on local woodlands, waterways, and wildlife corridors according to the latest project summaries released in late 2025. Teams combined satellite imagery with on-ground surveys to chart vegetation types, soil conditions, and habitat connectivity across several hundred hectares while researchers tracked seasonal changes in plant cover and water flow patterns. The effort revealed extensive ancient woodland patches along the eastern boundary and multiple wetland zones that support breeding populations of amphibians and migratory birds.
Project Scope and Methods
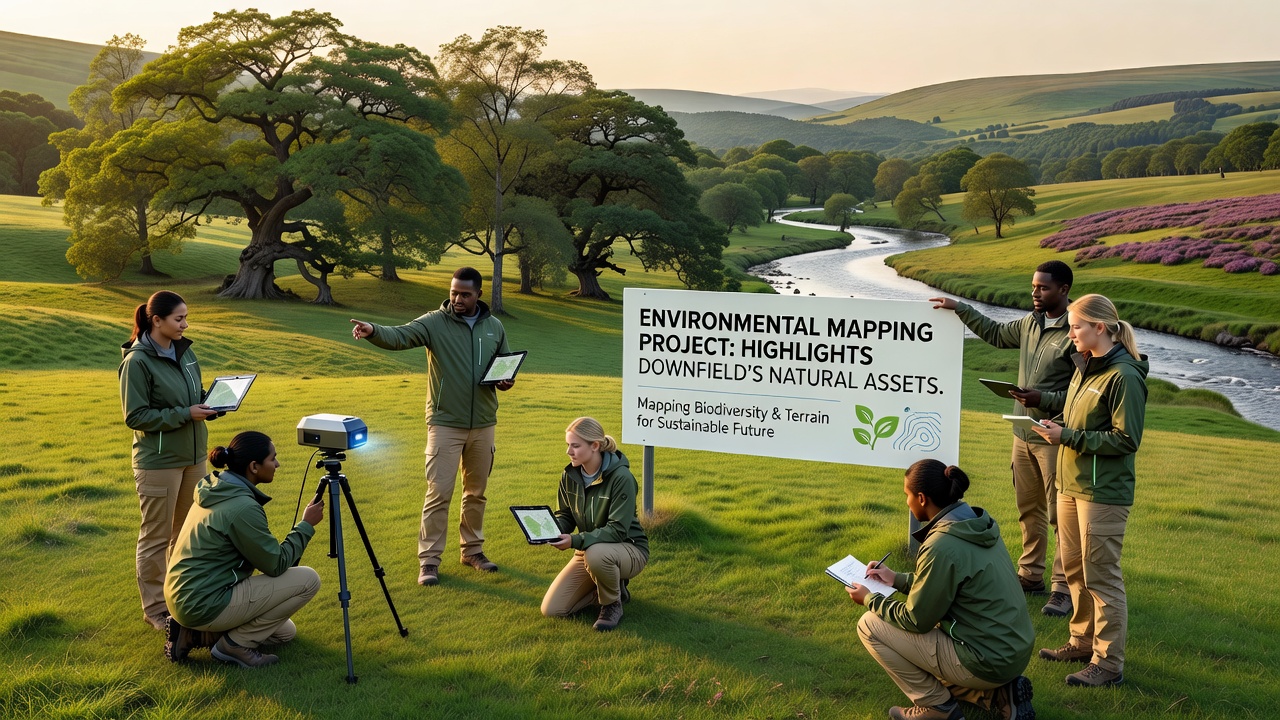
Surveyors began work in spring 2025 and continued through October 2026 when final ground-truthing rounds confirmed remote sensing results across riverine and grassland sites. They deployed LiDAR scanners alongside drone photography to generate three-dimensional terrain models that highlighted subtle elevation changes affecting drainage and species distribution. Data layers incorporated historical records from local archives so analysts could compare current habitat extent with conditions documented in the 1990s and early 2000s.
Equipment included handheld GPS units for precise boundary marking while biologists recorded species presence through audio monitoring stations placed at twenty fixed locations. These stations captured nocturnal calls from bats and owls providing quantitative counts that feed into regional biodiversity databases. Soil samples collected at regular intervals underwent laboratory analysis for nutrient levels and contaminant traces allowing the team to flag areas requiring targeted restoration measures.
Key Natural Assets Identified
Mapping outputs show that Downfield contains 180 hectares of semi-natural woodland dominated by oak and ash stands interspersed with hazel coppice. These areas link to broader ecological networks extending beyond town boundaries and provide corridors for mammals such as badgers and deer. Water features include two main streams that converge near the central parkland and feed into a series of ponds supporting dragonfly and newt populations according to field logs.
Grassland habitats cover roughly 95 hectares with several parcels classified as species-rich meadow supporting orchids and pollinator communities. The project documented 47 distinct plant species across these meadows during peak flowering periods in summer 2026 and noted stable populations of ground-nesting birds in less disturbed sections. Wetland zones total 32 hectares and exhibit high carbon storage potential based on peat depth measurements taken at multiple test pits.
Data Integration and Applications
Project coordinators uploaded all layers to an open-access geographic information system platform that local planners and conservation groups can query for specific attributes. This database allows users to overlay proposed development footprints against habitat sensitivity scores so decision makers can identify lower-impact routing options. The platform also includes predictive models showing how climate projections through 2050 might alter vegetation composition and water availability.
Partners from the European Environment Agency contributed calibration datasets drawn from comparable mapping initiatives in the Netherlands while analysts referenced reports from Environment and Climate Change Canada on wetland carbon accounting methods. These cross-regional inputs helped refine local classification algorithms and improved accuracy for habitat type identification. The combined dataset now serves as a baseline for monitoring future changes and supports grant applications aimed at habitat enhancement schemes.
Community and Planning Uses
Town residents have accessed preliminary maps through public workshops held in community halls where project staff explained layer meanings and answered questions about specific sites. Schools incorporated simplified versions into geography lessons allowing students to explore local ecology using interactive tools. Planning officers reference the maps when reviewing applications for new housing or infrastructure so they can apply buffer zones around sensitive habitats identified during the survey.
Maintenance schedules for public green spaces now incorporate findings on invasive species locations so crews can prioritize removal efforts in areas where native flora face competition. The mapping also flagged several veteran trees requiring protection orders and these records feed into an updated tree preservation database maintained by the local authority.
Conclusion
The environmental mapping project supplies verifiable spatial data that documents Downfield's natural assets in greater detail than previous records allowed. Updated layers reflect conditions observed through October 2026 and establish a foundation for ongoing monitoring programs. Local organizations continue to draw on the database when designing habitat management plans and when coordinating with neighboring districts on connected ecological corridors.